
Ode to Oceanography: A Vintage Map Of Santa Monica Bay, California, USA
- The Persaud Foundation

- Oct 15, 2025
- 4 min read
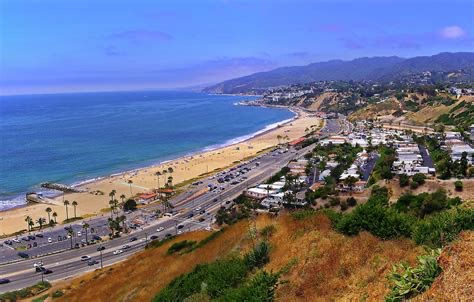
Today’s vintage nautical chart is a 51-year-old chart of Santa Monica Bay, California, USA! This chart depicts the entirety of Santa Monica Bay, a well-known bay immediately west of Los Angeles known for its vibrant marine scenes, natural beauty, & economic importance. It showcases the developments around the bay as well, including Los Angeles International Airport, the Pacific Palisades, Palos Verdes, & El Segundo. However, these various developments have all proliferated since the chart’s publication, & in the case of the Pacific Palisades, have been impacted by horrific wildfires.
The map is in English, although the script’s letters are thin in some places making it mildly difficult to understand. It contains a tremendous amount of information on different marine depths, coves, inlets, & harbours along the bay, making it an indelible resource for any sailor of the era. It also contains a magnetic compass rose, which would have been extremely useful for understanding the orientation of different features, the directions of different locations relative to one another, & generally navigation.
The chart is also rather large at 27 inches wide by 33.5 inches long. Its condition is superb, with colours being clear as well as bright, no rips or tears, little yellowing, no folds or creases, & no cracks.
In today’s article, we shall discuss the map itself, & perform an analysis of it! With that being said, let us delve into the mild waters of Santa Monica Bay!
The Map

As mentioned previously, the subject of this map is Santa Monica Bay. Santa Monica Bay is a very prominent bay, located immediately west of Los Angeles. It has numerous prominent cities along its shores, including El Segundo, Pacific Palisades, Playa Del Rey, Malibu, & its namesake Santa Monica. The area is a highly economically prosperous area for the county of Los Angeles, & California as a whole. It is also rather culturally important, as it is closely associated with the local film, tourism, & fishing industries. The bay itself is approximately 385 square miles, & has roughly 55 miles of pristine coastline.
The chart has a trichromatic colour scheme, sticking to yellow for land, light blue for the sea, & purple for details such as the compass rose in the center.
The map has a variety of bathymetric information, with information about sea floor depth, in fathoms (1 fathom = 6 feet), pipelines, & information about coastal developments. This would have made it highly useful to any sailor who frequented the area. Although the information about coastal developments is long outdated, it was useful for its time. Small markings such as, “wreck”, “anchorage area”, & “fish haven”, are present on the chart. In this context, a fish haven is an area with rocks, concrete, or some other hard material that attracts fish, & sessile organisms such as bivalves. This likely would have been used by fishermen who purchased the map & wished to find plentiful areas.
As mentioned prior, the chart is in lovely condition, with no visible rips, tears, creases, or folds.
An Analysis Of The Chart
This chart was designed & manufactured in 1974 by the United States Department of Commerce’s National Ocean Survey. The National Ocean Survey was created by the Department of Commerce to enhance, preserve, & better the marine ecosystems, & oceanic environment surrounding the US. Eventually, it was renamed to the National Ocean Service, & today has over 1,700 scientists on payroll. The agency is headquartered in Silver Spring Maryland, which is most likely where the map was manufactured.
The map was made for civilian purposes, for sailors, fishermen, & merchants alike, who frequent the bay.
Considering the quality of the chart, it was most likely manufactured using Lithography.
Lithography is a method of printing that arose in the 1820s, & remained the most popular method of printing in both color & grayscale until the early 1960s, when more efficient methods became available. Although it has existed since the mid-1790s, it took a long time to gain popularity in Europe due to technical difficulties, & only began gaining commercial popularity in the early 1820s. It is still widely used for certain kinds of printing, such as fine art printing today, however, digital printing is far more common.
In the lithographic method, the artist will draw directly onto a printing surface, such as zinc, or copper, until they are satisfied with the drawing. After this, the surface will be covered with a chemical etch, which will bond it to the surface. With this process, the blank areas will attract moisture to the plate & repel the lithographic ink, while the areas that are drawn on will hold the ink. Water is then wiped onto the unpainted areas to help prevent the ink from deviating. After the image is inked, the paper is laid over it & covered with a tympan, & the tympan is pressed down. Finally, these materials pass through the scraper bar of the litho-press. Afterward, an exact copy of what was supposed to be printed is revealed. It is extremely useful for making high-resolution prints in high quantities.
Directories / Credits
All credit for this map analyzed today goes to Rare Maps, a California rare & antique maps store. To purchase this chart, antique atlases, or other cartographic objects, please visit www.raremaps.com. To be clear, this is not an advertisement for Rare Maps, as we do not have a partnership with them.
Strategic Partnerships
Reel Guppy Outdoors
SharkedSkooler
Marine Enthusiasts Podcast
Tides of Tomorrow
Cash Daniels
The Open Book, Topanga
Pitfire Artisan Pizza
Olivenbaum Music
Our Loyal Patrons
P. R. Ochoa


Comments